- Multi-language debug Node.js, Go, Rust, Zig, Swift, C/C++ (all via
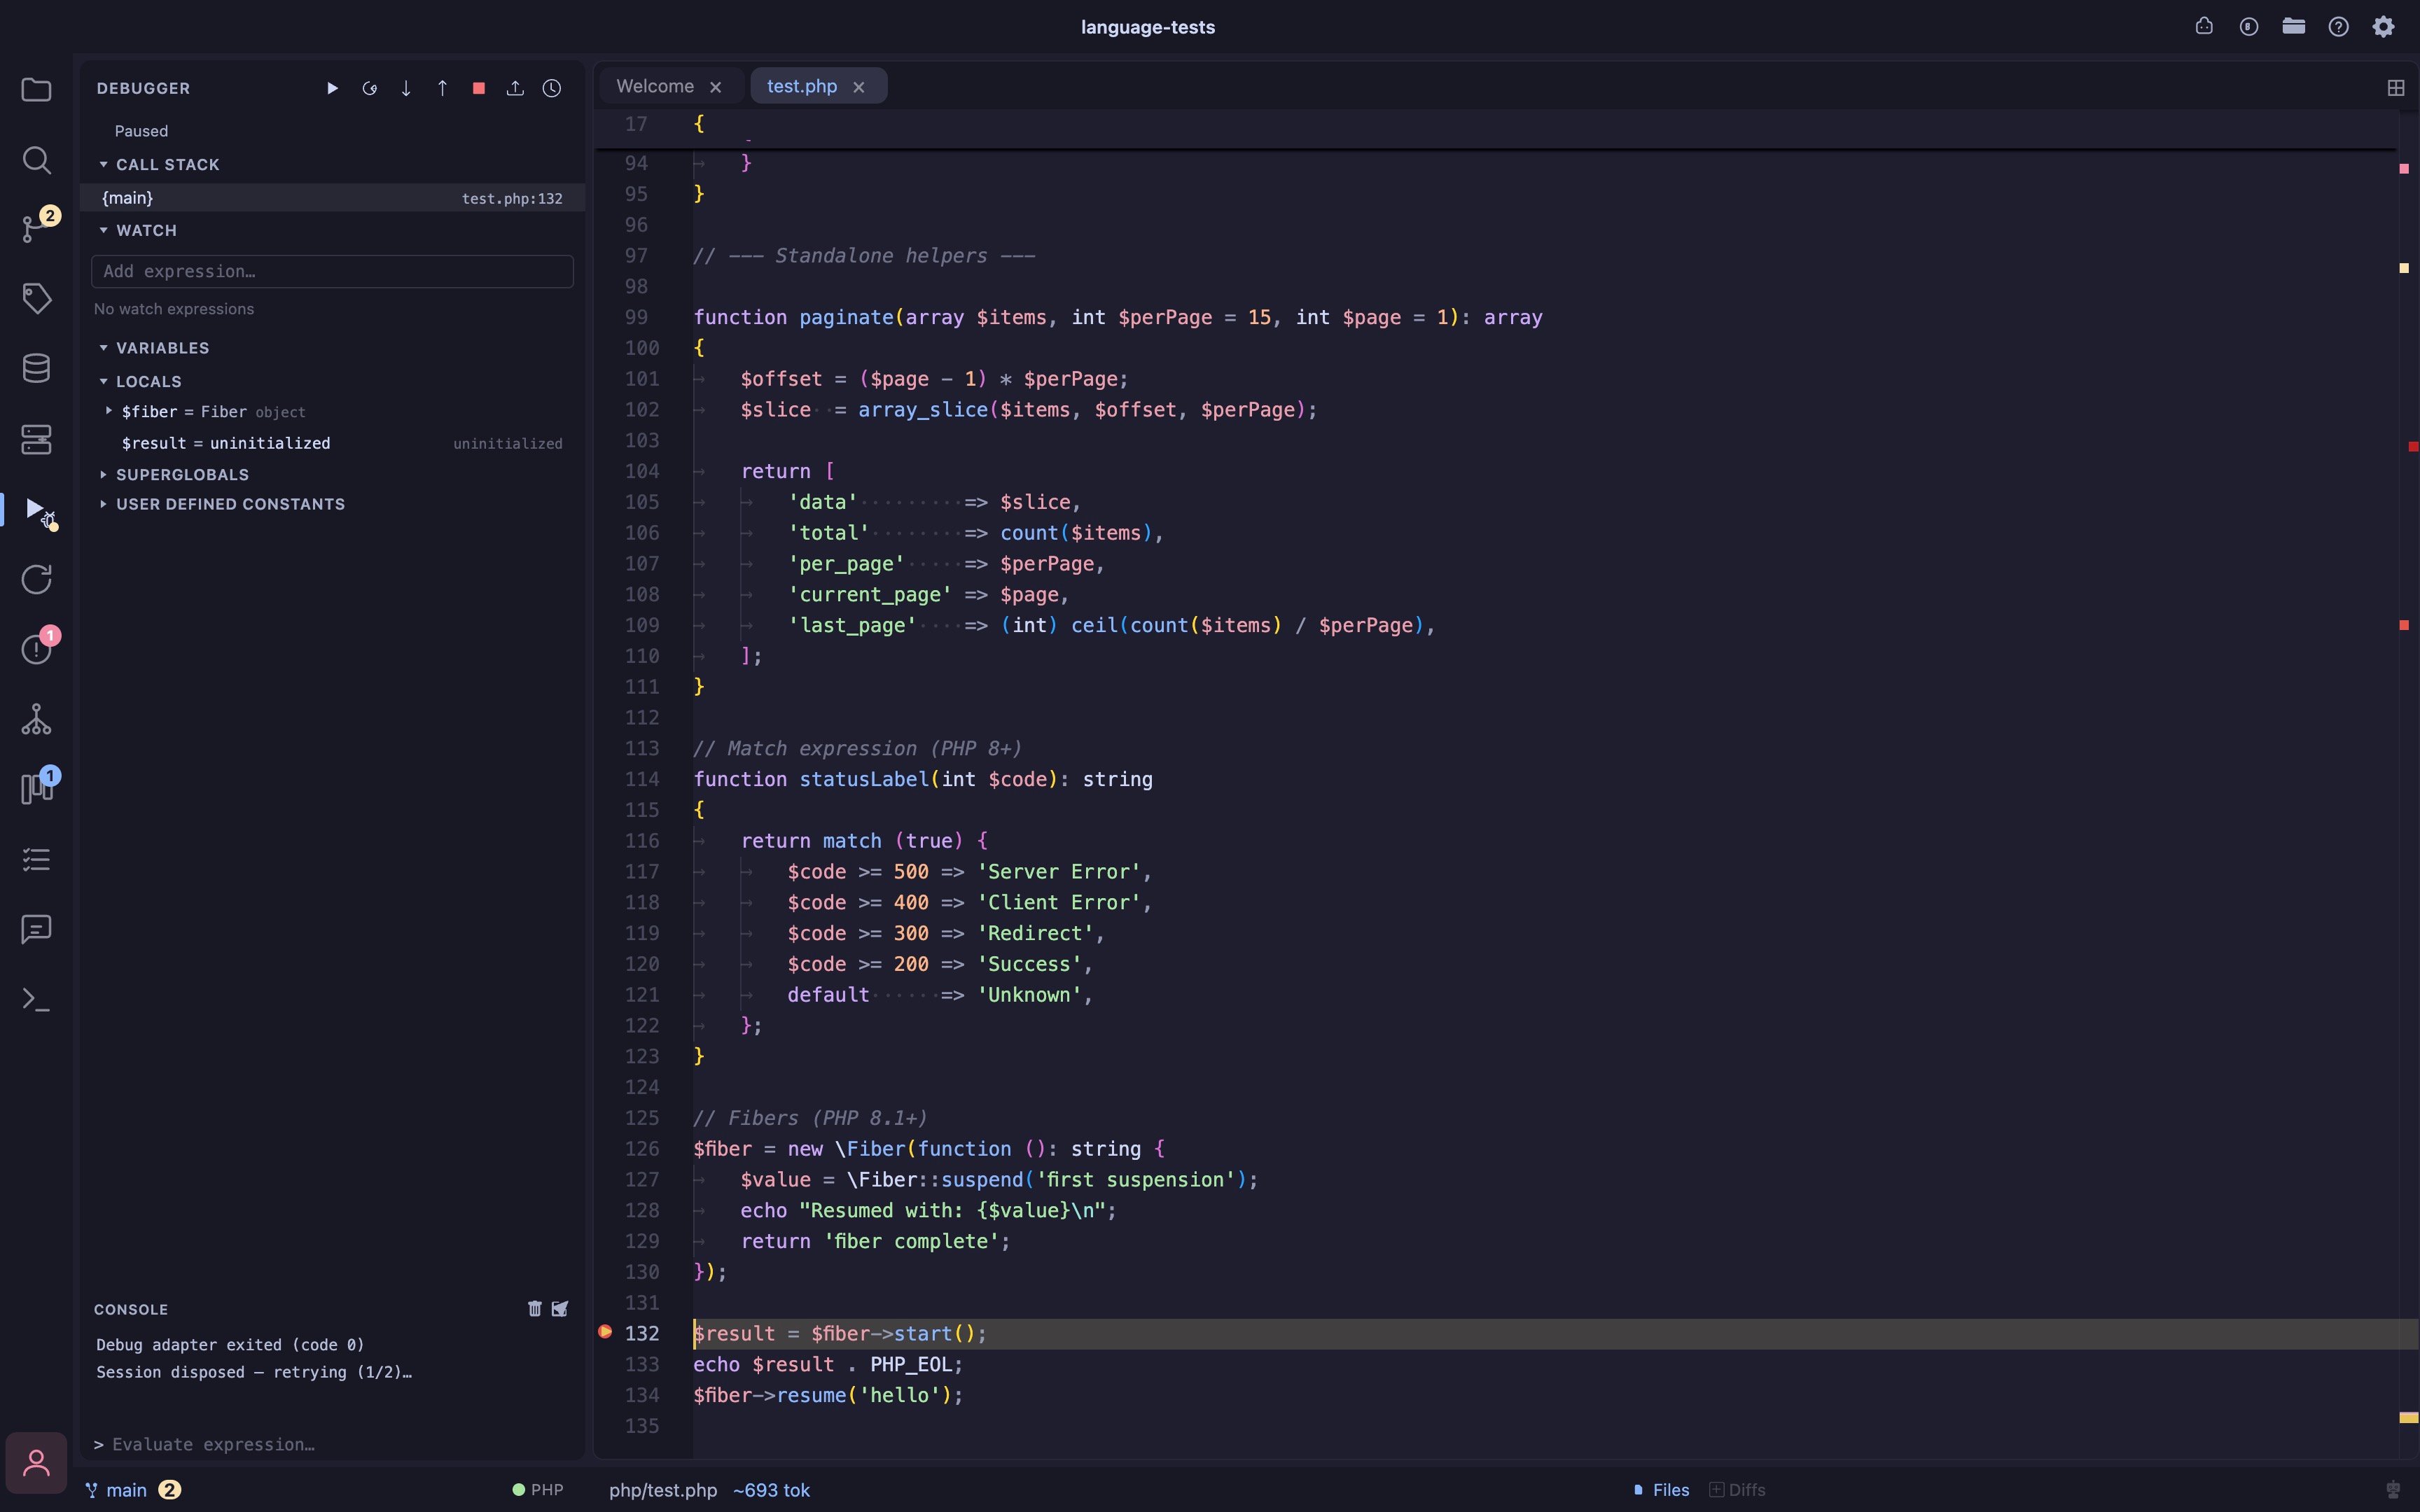
lldb-dapexcept Go/Node), Python, Ruby, and PHP (via xdebug) using the Debug Adapter Protocol (DAP); language auto-detected from the project, or manually selected in the launch form - Step controls Continue, Step Over, Step In, Step Out, and Stop; controls are disabled while the program is running and re-enable on each pause
- Call stack full stack trace on every pause; click any frame to load its local scope
- Variables all in-scope variables grouped by scope (Locals, Superglobals, etc.) with syntax-colored values and expandable objects/arrays
- Watch expressions add any expression to the Watch panel; evaluated at every pause using DAP
context: watch; results update live and changed values are highlighted - Debug console program output (stdout/stderr), adapter messages, and REPL in one scrollable panel; each category is color-coded; the REPL evaluates arbitrary expressions in the current frame
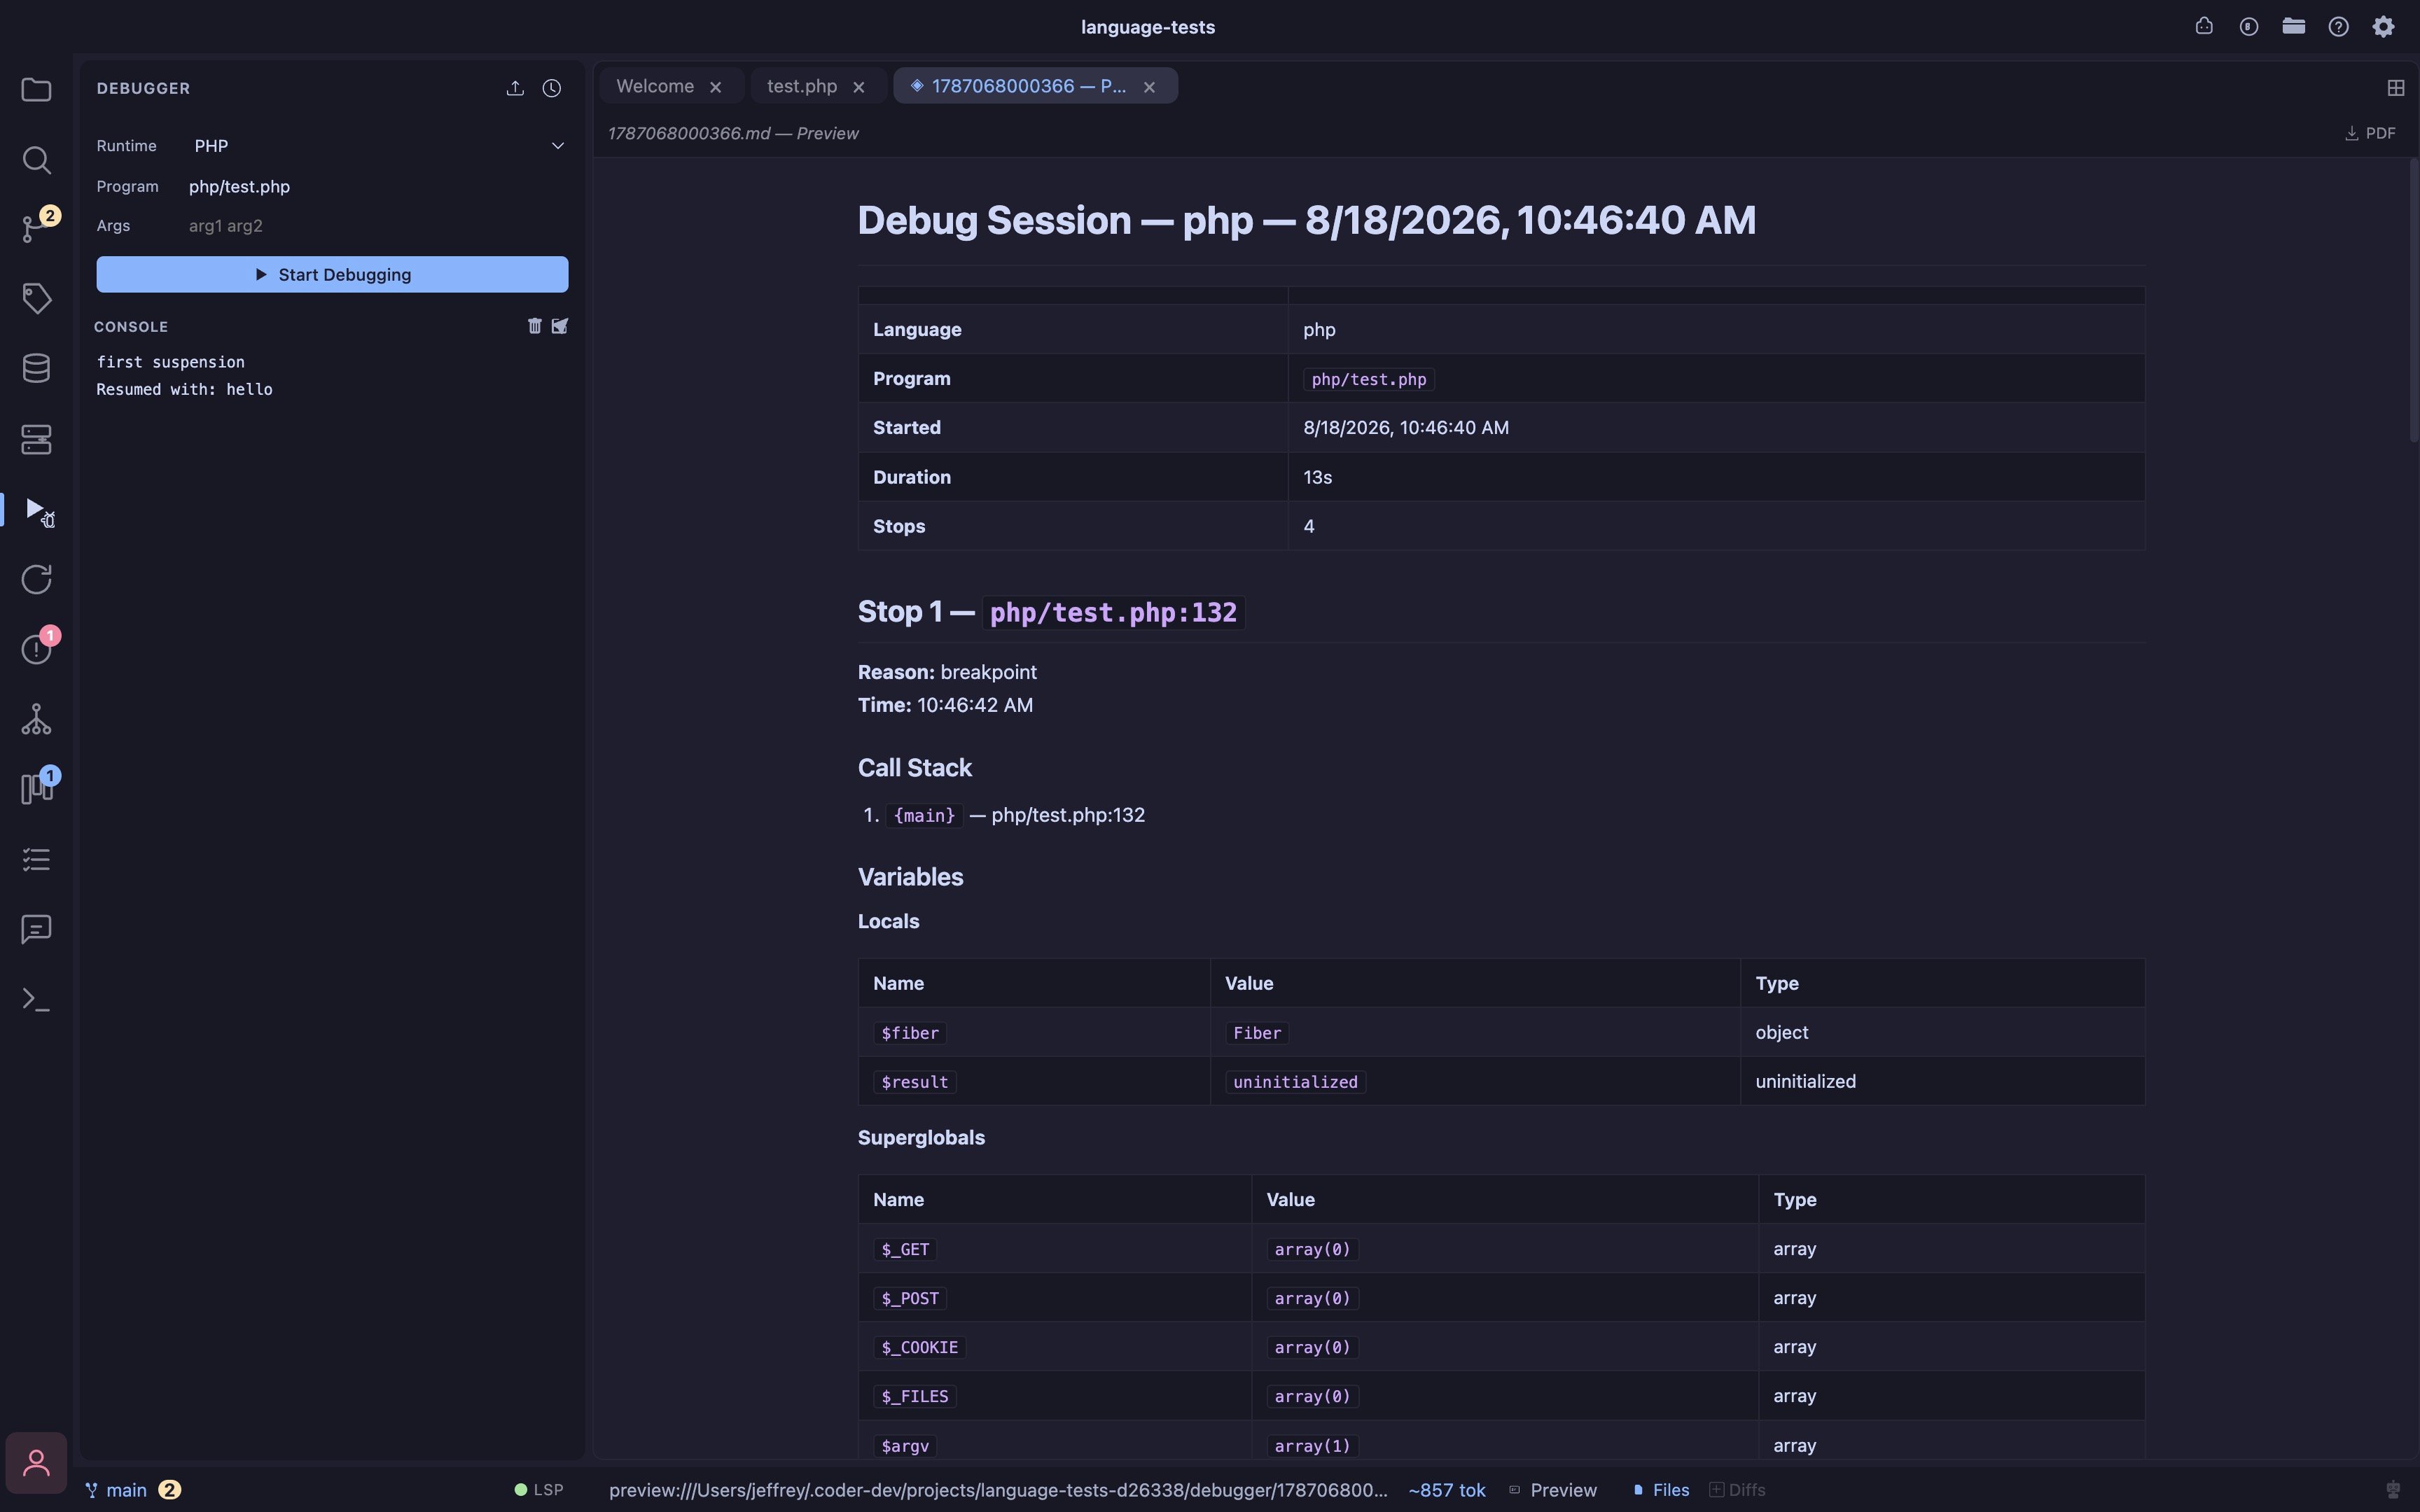
- Session recording every debug session is automatically recorded to
~/.coder/projects/{id}/debugger/{timestamp}.jsonlin NDJSON format (one JSON record per line); sessions with zero stops are discarded automatically so timing noise from xdebug reconnects never pollutes history - Export to Markdown / HTML export the full session, every stop, every variable, the complete call stack, and all console output, to a formatted
.mdor.htmlfile; the exported file opens automatically as a new editor tab - Copy as AI-readable text one-click copy of the entire session as a clean, compact text summary ready to paste into any AI chat; noise is stripped (empty values,
$_SERVER,$argv,$argc, constants scopes) and variables that changed between stops are flagged with* - Session history clock icon in the debugger header opens a modal listing every recorded session for the current project with language, entry-point filename, and timestamp; each entry has copy-as-text and export (MD/HTML) actions
- Retry on dispose xdebug can close its socket before a new attach completes; the debugger retries automatically up to 3 times with escalating backoff (800 ms / 1600 ms) so a stale socket never blocks a fresh run
- Toggle
Cmd+Shift+Dopens and closes the Debugger panel
Requirements
The debugger connects to debug adapters you have installed, none of them ship with Coder. See Language Intelligence → DAP, debuggers for the general picture, and each language’s own page for its adapter’s exact install steps and gotchas: PHP · TypeScript / JavaScript · Go · Rust · Zig · Python · Swift · C / C++ · Ruby Most compiled languages (Rust, Zig, Swift, C/C++) share the samelldb-dap setup (ships with the Xcode Command Line Tools via xcode-select --install, or brew install llvm) and require a binary you’ve already built (cargo build / zig build / swift build / your C compiler), the debugger doesn’t invoke any of those build tools for you.
Debugger Reports